Thoughts of an old curmudgeon, born and raised in Fernandina, before they added the Beach. Fernandina is in Nassau County, FL. Nassau County is between Jacksonville and the Georgia line, yes there is something above Jacksonville.
Thus the intent of Dobbs to return control to the state has been achieved. From May 1st to November 5th the 1928 Abortion law will be in effect, and Arizona voter will determine the law going forward.
References
Arizona Court Decision
IN THE SUPREME COURT OF THE STATE OF ARIZONA PLANNED PARENTHOOD ARIZONA, INC., SUCCESSOR-IN-INTEREST TO PLANNED PARENTHOOD CENTER OF TUCSON, INC.; LAURA CONOVER, PIMA COUNTY ATTORNEY, Appellants, v. KRISTIN K. MAYES, ATTORNEY GENERAL OF THE STATE OF ARIZONA, Appellee, URL of PDF.
Academic Analysis
Arizona Abortion Law if Roe v. Wade is Overturned– Guidance, Slade Smith JD, Kirin Goff, JD MA, University of Arizona, Zuckerman College of Public Health , Applied Health Policy Institute [PDF URL]
Old Curmudgeon’s Analysis
When the Supreme Court of the United States’ (SCOTUS) Dobbs Decision was decided on June 24, 2023 Arizona’s abortion law reverted to the existing law in effect prior to the Roe vs Wade decision (1973).
The pre-Roe v Wade abortion Arizona law was:
“In 1864, the First Legislative Assembly published a code of laws governing the territory of Arizona. See Howell Code (1864). The Howell Code established Arizona’s first criminal code, which included constraints on abortion. In 1901, the Twenty-First Legislative Assembly enacted a penal code reiterating the abortion law, dividing criminality between people who facilitate abortions and women who solicit assistance to procure an abortion. See Revised Statutes of Arizona, Penal Code §§ 234, 244 (1901). This language was adopted in whole in 1913, after Arizona statehood. See Revised Statutes of Arizona, Penal Code § 273 (1913). In 1928, the Arizona Legislature codified abortion criminality in A.R.S. §§ 13-211 to -213.”In 1864, the First Legislative Assembly published a code of laws governing the territory of Arizona. See Howell Code (1864). The Howell Code established Arizona’s first criminal code, which included constraints on abortion. In 1901, the Twenty-First Legislative Assembly enacted a penal code reiterating the abortion law, dividing criminality between people who facilitate abortions and women who solicit assistance to procure an abortion. See Revised Statutes of Arizona, Penal Code §§ 234, 244 (1901). This language was adopted in whole in 1913, after Arizona statehood. See Revised Statutes of Arizona, Penal Code § 273 (1913). In 1928, the Arizona Legislature codified abortion criminality in A.R.S. §§ 13-211 to -213.” op. cit. Court Decision
In 1971, Planned Parenthood Center of Tucson, Inc. sued the Attorney General challenging the constitutionality of Arizona’s abortion statutes under both the state and federal constitutions. op. cit.
In 1973, after Nelson upheld § 13-211’s constitutionality, the United States Supreme Court recognized a federal constitutional right to an abortion in Roe v Wade. This new right established by Roe was inconsistent with § 13-211, so the Arizona Court of Appeals revisited the issue in Marks, this time holding the statute unconstitutional because of Roe and enjoining enforcement1 of § 13-211. Nelson, 19 Ariz. App. at 152.op. cit.
With the Dobbs decision this enjoining enforcement became moot and the 1928 A.R.S. §§ 13-211 to -213 became Arizona law again.
The Bottom Line
Arizona’s legislature had 49 years in which they could have crafted an Arizona abortion law that codified Roe, but they didn’t. As a result of SCOTUS reversal Roe v Wade Arizona’s abortion law will revert to the 1928 A.R.S. §§ 13-211 to -213 on May 1st. The Arizona Supreme Court also approved a ballot measure for a constitutional amendment to protect abortion right.
The measure: “The Arizona Right to Abortion Initiative may appear on the ballot in Arizona as an initiated constitutional amendment on November 5, 2024.
The ballot initiative would establish the fundamental right to abortion that the state of Arizona may not interfere with before the point of fetal viability (defined as the point of pregnancy when there is significant chance of the survival of the fetus outside of the uterus without the application of extraordinary medical measures) unless justified by a compelling state interest (defined as a law or regulation enacted for the limited purpose of improving or maintaining the health of the individual seeking abortion care that does not infringe on that individual’s autonomous decision making) [Ballotpedia]
Thus the intent of Dobbs to return control to the state has been achieved. From May 1st to November 5th the 1928 Abortion law 2 will be in effect, and Arizona voter will determine the law going forward.
Footnotes
Enjoin is the verb form of the term injunction, which means prohibit someone from doing something by issuing an injunction, in other words, a court enjoins something when it issues an injunction against it. ↩︎
I am a states-rights advocate who believes the Federal Government is limited to its enumerated powers, and the commerce clause is not an “anything else” clause established by the 1942 Wickard v. Filburn Case.
I therefore was interested in finding out the impact of the Dobbs decision.
Introduction
In January 1973, the Supreme Court issued a 7–2 decision in McCorvey’s1 favor holding that the Due Process Clause of the Fourteenth Amendment to the United States Constitution provides a fundamental “right to privacy”, which protects a pregnant woman’s right to an abortion. It also held that the right to abortion is not absolute and must be balanced against the government’s interests in protecting women’s health and prenatal life. It resolved these competing interests by announcing a pregnancy trimester timetable to govern all abortion regulations in the United States. The Court also classified the right to abortion as “fundamental”, which required courts to evaluate challenged abortion laws under the “strict scrutiny” standard, the most stringent level of judicial review in the United States.
{In the 2022 Dobbs decision the court’s decision overruled both Roe v. Wade (1973) and Planned Parenthood v. Casey (1992), returning to individual states the power to regulate any aspect of abortion not protected by federal statutory law.}
{Prior to Roe v. Wade, 30 states prohibited abortion without exception, 16 states banned abortion except in certain special circumstances (e.g. rape, incest, and health threat to mother), 3 states allowed residents to obtain abortions, and New York allowed abortions generally.}
I have always been struct by the dichotomy, if I was involved in an auto accident in which a fetus was “killed” and also the mother I could be prosecuted with two counts of manslaughter, yet the “killing” of a fetus in abortion is not a crime.
This is compounded by the failure of congress to codify abortion post Roe vs Wade, the Democrats have had four “trifectas”, in which they controlled both congress and the presidency. Especially during the year prior to the Dobbs decision, when they knew the challenge was coming up through the courts.
I am a state’s-rights advocate who believes the Federal Government is limited to its enumerated powers2, and the commerce clause is not an “anything else” clause.as established by the 1942 Wickard v. Filburn Decision3.
I therefore was interested in finding out the impact of the Dobbs decision. My personal opinion is in line with the states with 15 week (2nd trimester). CDC reports that 98.7% of all abortions are conducted in the first 20 weeks4 and 625,978 abortions were conducted in 20215 giving us 781 abortions in the 21st week or later. I will go out on a limb and postulate that a significant percentage of the 781 would have opted for an earlier abortion, if they were aware of a deadline.
Presidential Candidates’ Position
Biden
I said … on that day that Roe was overturned, the health and lives of women in this nation would now be at risk,” he said in his remarks. “And that has unfortunately proven to be true. They’ve been at risk.”
Biden also reiterated his call for Congress to codify protections that had been provided by Roe, adding that if a bill were passed, he would “immediately” sign it into law.
“Stop playing politics with the women’s lives and freedom. Let doctors do their job,” he said.
The administration has repeatedly urged Congress to pass a law that would restore the protections that existed under Roe, but that proved impossible even when Democrats controlled both the House and the Senate, so it is unlikely to happen any time soon.
… My view is now that we have abortion where everyone wanted it from a legal standpoint, the states will determine by vote or legislation, or perhaps both. And whatever they decide must be the law of the land. In this case, the law of the state.
Many states will be different. Many will have a different number of weeks, or some will have more conservative than others, and that’s what they will be. At the end of the day, this is all about the will of the people. …
As of November 2, 20236 there are; 14 States that ban abortions, 4 that allow abortions with gestational limits between 6 and 12 weeks, 7 that allow abortions with gestational limits between 15 and 22 weeks, and 26 with legal abortions beyond 22 weeks.
Figure 1, State Abortion Laws
Abortion on the 2024 Ballot
Figure 2, 13 [11] State may have abortion on the ballot, Florida will per January Florida Supreme Court decision as will Maryland.
On Ballot
Two states have advanced their Abortion Initiatives since Figure 2 was created.
Florida Ballot Initiative
Abortion
Limiting government interference with abortion.— Except as provided in Article X, Section 22, no law shall prohibit, penalize, delay, or restrict abortion before viability or when necessary to protect the patient’s health, as determined by the patient’s healthcare provider.
[Florida 6-week abortion ban takes effect May 1, 2024]
ARTICLE 48. THAT EVERY PERSON, AS A CENTRAL COMPONENT OF AN INDIVIDUAL’S RIGHTS TO LIBERTY AND EQUALITY, HAS THE FUNDAMENTAL RIGHT TO REPRODUCTIVE FREEDOM, INCLUDING BUT NOT LIMITED TO THE ABILITY TO MAKE AND EFFECTUATE DECISIONS TO PREVENT, CONTINUE, OR END ONE’S OWN PREGNANCY. THE STATE MAY NOT, DIRECTLY OR INDIRECTLY, DENY, BURDEN, OR ABRIDGE THE RIGHT UNLESS JUSTIFIED BY A COMPELLING STATE INTEREST ACHIEVED BY THE LEAST RESTRICTIVE MEANS.
Filburn was a small farmer in Ohio who harvested nearly 12 acres of wheat above his allotment under the Agricultural Adjustment Act of 1938. Filburn was penalized under the Act. He argued that the extra wheat that he had produced in violation of the law had been used for his own use and thus had no effect on interstate commerce, since it never had been on the market. In his view, this meant that he had not violated the law because the additional wheat was not subject to regulation under the Commerce Clause. ↩︎
Raw Data: Abortions By Week of Pregnancy, Mother Jones ↩︎
Abortion Surveillance — United States, 2021, CDC↩︎
has returned to its pre-pandemic February 2020 level,
remains below its February 2020 level,
below the average monthly gain of X over the prior 12 months,
A job gain in general merchandise retailers (+20,000) was partially offset by job losses in building material and garden equipment and supplies dealers (-10,000) and in automotive parts, accessories, and tire retailers (-3,000),
little changed in retail trade (+18,000), …
Source
Employment Situation Summary – March 20241, Bureau of Labor Statistics, Economic News Release, Friday, April 5, 2024, (Source URL)
Typography, normal text is source text, bold italics is Old Curmudgeon’s opinion unless otherwise noted. Underlined italics is Old Curmudgeon’s emphasis.
Household Survey Data
Author’s Summary
Of the six metrics discussed none had significant improvement and the Black, African American component of Unemployment increased back to its November 2021 rate. While Asian and Hispanic saw declines. The remaining five were essentially flat.
While a metric not reported, U.S. Bureau of Labor Statistics, Civilian Labor Force Level – Foreign Born, saw a drop compared to February’s historical high. But has risen 17% from a January 2021 baseline, Figure 1.
Figure 1, Foreign Born in the Workforce since Joe Biden took office.
Another metric not reported in the Job’s Report is Real (inflation adjusted) Usual Weekly Real Earning, Figure 2 which is slowly increasing back to it January 2021 baseline. It is currently at 99.5% of the January 2021 baseline, after a low in the 2nd quarter of 2022. It has been underwater since President Biden took office, based on most recent quarterly data, 4th quarter 2023, reported January 14th 2024.
Figure 2, Inflation Adjusted Median Usual Wage since Biden took office.
Unemployment
Both the unemployment rate, at 3.8 percent , and the number of unemployed people, at 6.4 million, changed little in March. The unemployment rate, Figure 3, blue line, has been in a narrow range of 3.5 percent to 3.9 percent since February 2022, . I would attribute the drop from January 2021 to February 2022 to post-pandemic job recovery.
Figure 3, Unemployment Total, blue line and Demographics During Biden’s Term
Among the major worker groups,
the unemployment rate for Blacks (6.4 percent) increased in March, to its November 2021 level (6.4 percent), Figure 4, red circle.
while the rates for Asians (2.5 percent) and Hispanics (4.5 percent) decreased, green circle.
The jobless rates for adult men (3.3 percent), adult women (3.6 percent), teenagers (12.6 percent), and Whites (3.4 percent) showed little or no change over the month, op. cit.
Figure 4, February vs March Comparison
Long Term Unemployed
The number of long-term unemployed (those jobless for 27 weeks or more), at 1.2 million, was little changed in March. It has been in the 1.050 M – 1.326 M range since June 2022, Figure 5. The long-term unemployed accounted for 19.5 percent of all unemployed people.
Figure 5, Long-Term Unemployed During Biden’s Term
Labor Force Participation Rate
Both the labor force participation rate, at 62.7 percent, and the employment-population ratio, at 60.3 percent, were little changed in March. The participation rate has showed little change since October 2021, 62.3% ±0.5%, Figure 6.
Figure 6, Labor Force Participation Rate for Biden’s term.
Employed Part Time For Economic Reasons
The number of people employed part time for economic reasons, at 4.3 million, changed little in March. And has been relatively stable since June 2023, Figure 7. These individuals, who would have preferred full-time employment, were working part time because their hours had been reduced or they were unable to find full-time jobs.
Figure 7, Employment Level – Part Time for Economic Reasons
Not In Labor Force Who Currently Want A Job
In March, the number of people not in the labor force who currently want a job, at 5.4 million, was little changed. And, has been volatile within a band, 5.793 M – 4.959 M, since November 2022, Figure 8. These individuals were not counted as unemployed because they were not actively looking for work during the 4 weeks preceding the survey or were unavailable to take a job.
Figure 8, Not in Labor Force – Want a Job Now
Marginally Attached to the Labor Force
Among those not in the labor force who wanted a job, the number of people marginally attached to the labor force, at 1.6 million, was little changed in March. These individuals wanted and were available for work and had looked for a job sometime in the prior 12 months but had not looked for work in the 4 weeks preceding the survey. The number of discouraged workers, a subset of the marginally attached who believed that no jobs were available for them, was little changed at 337,000 in March.
Establishment Survey Data
Author’s Summary
The eleven metrics tracked had less than stellar performance, some of the quantifying terms used:
has returned to its pre-pandemic February 2020 level,
remains below its February 2020 level,
below the average monthly gain of X over the prior 12 months,
A job gain in general merchandise retailers (+20,000) was partially offset by job losses in building material and garden equipment and supplies dealers (-10,000) and in automotive parts, accessories, and tire retailers (-3,000),
little changed in retail trade (+18,000),
Employment showed little or no change over the month,
[wages] increased by 12 cents, or 0.3 percent, to $34.69, inflation adjusted wages have been underwater since President Biden took office.
Report’s Metrics
Total nonfarm payroll employment rose by 303,000 in March, higher than the average monthly gain of 231,000 over the prior 12 months. In March, job gains occurred in health care, government, and construction.
Health care added 72,000 jobs in March, above the average monthly gain of 60,000 over the prior 12 months. In March, job growth continued in ambulatory health care services (+28,000), hospitals (+27,000), and nursing and residential care facilities (+18,000).
In March, employment in government increased by 71,000, higher than the average monthly gain of 54,000 over the prior 12 months. Over the month, employment increased in local government (+49,000) and federal government (+9,000). Consistent with the prior 12 month average2, and the largest non-census federal workforce since December 1994, Figure 9.
Figure 9, All Federal Employees, November 1994 – March 2024
Construction added 39,000 jobs in March, about double the average monthly gain of 19,000 over the prior 12 months. Over the month, employment increased in nonresidential specialty trade contractors (+16,000).
Employment in leisure and hospitality trended up in March (+49,000) and has returned to its pre-pandemic February 2020 level. Over the prior 12 months, job growth in the industry had averaged 37,000 per month.
Employment in the other services industry continued its upward trend in March (+16,000). The industry had added an average of 8,000 jobs per month over the prior 12 months. Employment in other services remains below its February 2020 level by 40,000, or 0.7 percent.
Employment in social assistance continued to trend up in March (+9,000), below the average monthly gain of 22,000 over the prior 12 months.
In March, employment was little changed in retail trade (+18,000). A job gain in general merchandise retailers (+20,000) was partially offset by job losses in building material and garden equipment and supplies dealers (-10,000) and in automotive parts, accessories, and tire retailers (-3,000).
Employment showed little or no change over the month in other major industries, including mining, quarrying, and oil and gas extraction; manufacturing; wholesale trade; transportation and warehousing; information; financial activities; and professional and business services.
In March, average hourly earnings for all employees on private nonfarm payrolls increased by 12 cents, or 0.3 percent, to $34.69. Over the past 12 months, average hourly earnings have increased by 4.1 percent. In March, average hourly earnings of private-sector production and nonsupervisory employees edged up by 7 cents, or 0.2 percent, to $29.79. While “Real” inflation adjusted Median usual weekly real earnings have been underwater since President Biden took office (op. cit. Figure 2).
In March, the average workweek for all employees on private nonfarm payrolls edged up by 0.1 hour to 34.4 hours. In manufacturing, the average workweek was unchanged at 40.0 hours, and overtime edged down by 0.1 hour to 2.9 hours in March. The average workweek for production and nonsupervisory employees on private nonfarm payrolls edged up by 0.1 hour to 33.9 hours.
The change in total nonfarm payroll employment for January was revised up by 27,000, from +229,000 to +256,000, and the change for February was revised down by 5,000, from +275,000 to +270,000. With these revisions, employment in January and February combined is 22,000 higher than previously reported. (Monthly revisions result from additional reports received from businesses and government agencies since the last published estimates and from the recalculation of seasonal factors.)
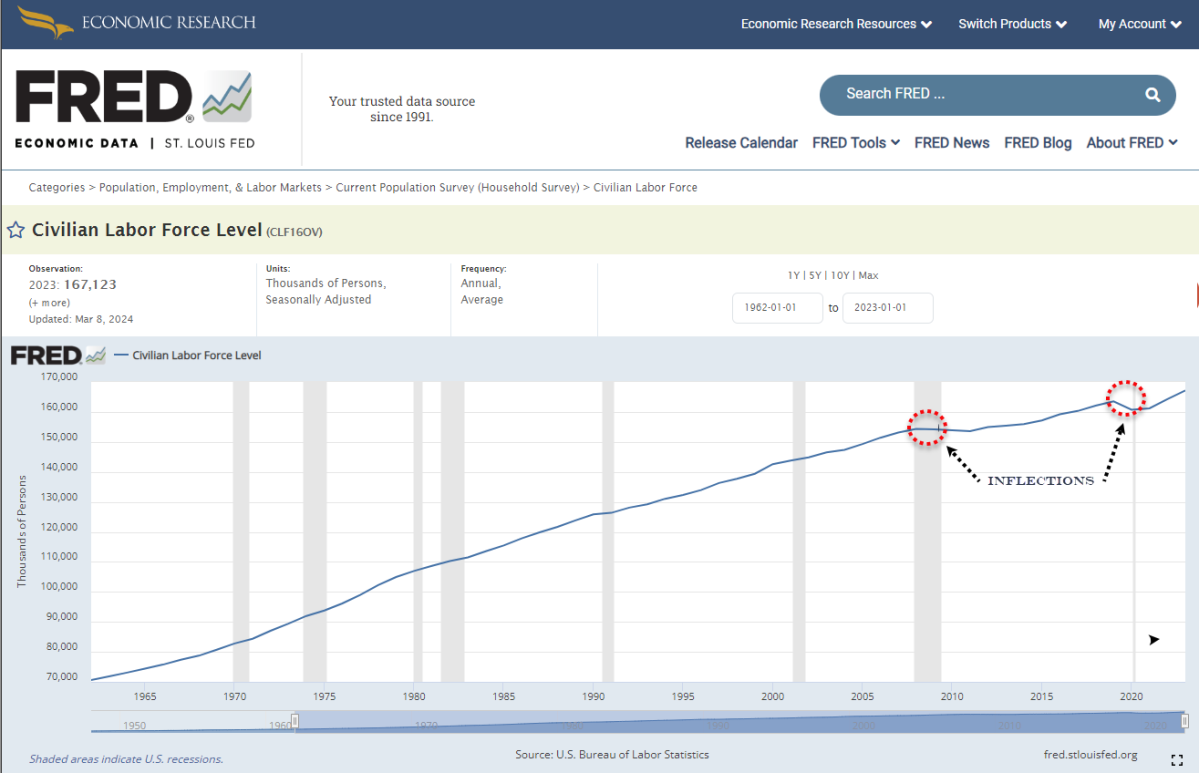
In 1962, the year I graduated from high school the U.S. Bureau of Labor Statistics1 reported there were 70,619,000 people in the seasonally adjusted civilian workforce. By 2023 there were 167,123,000. There were two major inflections, 2008 – 2011 recession and recovery and 2020 – 2021 pandemic and recovery. I will take the liberty of breaking the “curve” down into three linearized segments,
2021 – 2023 – Post 2020 Pandemic (President Biden’s Term)
and project each to 2030, figure 1.
Figure 1 Linear approximation of Civilian Workforce with projection to 2030
Figure 1 show that the post 2008 projection, dashed green, did not recover the jobs lost in the recession, i.e. intersect the baseline projection. The difference in 2019 was 10.8 million jobs lost compared to the baseline projection. The post pandemic jobs did recover to the post recession projection, green dashed line, in August of 20222. If the trend continues in 2030 it will represent a 13 million job loss compared to the baseline projection.
President Biden claims that each monthly jobs report represent “jobs created”. I would argue that until August of 2022 they were jobs recovered and since August of 2022 he gets credit for 1.175 million jobs being created on his watch.
Digging deeper into the data, focusing on the Biden term in office, January 2021 – February 2024. Figure 2 presents four data sets:
U.S. Bureau of Labor Statistics, Civilian Labor Force Level [CLF16OV], retrieved from FRED, Federal Reserve Bank of St. Louis; https://fred.stlouisfed.org/series/CLF16OV, March 11, 2024
U.S. Bureau of Labor Statistics, All Employees, Federal [CES9091000001], retrieved from FRED, Federal Reserve Bank of St. Louis; https://fred.stlouisfed.org/series/CES9091000001, March 11, 2024
U.S. Bureau of Labor Statistics, Civilian Labor Force Level – Foreign Born [LNU01073395], retrieved from FRED, Federal Reserve Bank of St. Louis; https://fred.stlouisfed.org/series/LNU01073395, March 11, 2024
U.S. Bureau of Labor Statistics, Labor Force Participation Rate – Black or African American [LNU01300006], retrieved from FRED, Federal Reserve Bank of St. Louis; https://fred.stlouisfed.org/series/LNU01300006, March 11, 2024
The data has been normalized to 100 on January 1, 2021. By February 2024:
Figure 2 Jobs Details 1 Jan 2021 – 1 March 2024
The civilian labor force was up 4.6%
All employees,Federal, was up 3.4%
Civilian labor force foreign born was up 18%
Labor participation Black or African American was up 5.7%.
I can only presume the Biden’s open border policy accounts for the large gain the foreign born made.
By comparison the same datasets, normalized to January 1, 2017. On March 1, 2020, Trump’s time in office pre-pandemic, the results were:
The civilian labor force was up 2.7%
All employees Federal was up 1.4%
Civilian labor force foreign born was up 5.8%
Labor participation Black or African American was up 1.5%.
I would conclude that the clear winners, in the jobs market, during President Biden’s were the foreign born.
Bidenomics
Civilian Workforce
The Biden Harris Team makes the claim “More people are working than at any other point in American history on the Whitehouse.gov tab The Record3 where they present this graphic:
Figure 3, Graphic from Whitehouse.gov
This claim became true in August of 2022, the 20th month of his term, see Figure 1. His predecessor was able to make this claim for the first 3-years and 3-months of his term. It was also true from the 3rd year of Biden’s Vice Presidency through the end of his VP term.
Inflation & Wages
Figure 4 show:
Inflation as measured by U.S. Bureau of Labor Statistics, Consumer Price Index for All Urban Consumers: All Items in U.S. City Average4 which is up 18% from January 1, 2021. And
U.S. Bureau of Labor Statistics, Average Hourly Earnings of All Employees, Total Private5 which is only up 15%.
Thus, wages are not keeping up with inflation.
Figure 4, Biden’s Inflation up 18.5% term to date
Gasoline Price
“And thanks to the President’s actions, including a historic release from the Strategic Petroleum Reserve, gas prices are down more than $1.60 from their summer 2022 peak.6“
Figure 5, SPR Reserve Drawdown
While at the same time US Regular Conventional Gas Price7 have increased 51.5% ($1.16). Or, as the Biden team says “And thanks to the President’s actions, including a historic release from the Strategic Petroleum Reserve, gas prices are down more than $1.60 from their summer 2022 peak.8“
I never knew the purpose of the SPR was to lower the cost of gasoline, which wasn’t in short supply. Were the proceeds of the sale put in escrow to offset the cost of replenishing the SPR?
Figure 6, US Regular Conventional Gas Price
National Debt
“The national debt ($34.47 T) is the total amount of outstanding borrowing by the U.S. Federal Government accumulated over the nation’s history.9” Figure 7, Total Public Debt10 shows that Trump accrued more debt than Biden, a 39.8% increase versus Biden’s 31.5%. But, Trump fronted all of the Covid vaccine cost and developed a vaccine in less than a year plus two rounds of direct to individuals Covid relief payments and the Paycheck Protection Program for businesses, which ended in Biden’s term in March of 2021.
Figure 7 show the total public debt for the Trump – Biden years, and the proportions accumulated by each. Remember Biden has a year to go.
Oh bye the way, the FY-24 accrued interest on the debt, as of February 29th was $124,675,414,714.34 (126.4 B).
Figure 7, Total Public Debt normalized 100 = 1 January 2021
Credit Cards and Other Revolving Plans, All Commercial Bank
Figure 8 presents the growth of Credit Cards and Other Revolving Plans, All Commercial Bank11. It show that credit card, etc. debt has increased 40.8% between January 1st, 2021 and February 2024. On January 29, 2020, pre-covid, it had only risen 19.3%, half of the Biden increase.
Figure 8, Credit Cards and Other Revolving Plans, All Commercial Bank
Figure 9 expands the time horizon to 2009 – Present, Obama term to Biden term with five milestones.
Figure 9, Credit Cards and Other Revolving Plans, All Commercial Bank 2009 – Present
The milestones are:
On 14 April 2010, after a sharp increase credit debt had increase 69.5% relative to the 1 January 2009 baseline.
By the end of the Obama term, after eight years, it was up 86% relative to the baseline.
Three years and three months into Trump’s term, 25 March 2020, pre-pandemic, it was up 120.8% relative to the baseline and 32.2% from the start of the Trump term.
By the time Trump left office, due to the pandemic, credit was down to 95% above the 2009 baseline.
Three years and two months into the Biden term credit is up to an all time high of 174% above the 2009 baseline.
Immigration
Table 1, created using data from Ice Annual Report, December 29, 202312, because the data is fiscal year it does not align with Presidential terms, but it is close enough to illustrate the magnitude of the differences.
Biden had 399 times as many encounters, 6.589 M. But only 6% were convictions, pending criminal charges or other immigration violations vice 25% for Trump. Either Biden was missing a lot, or had a population that was squeaky clean. I suspect it was the former.
In the FY 2023 group of 73,822 individuals with criminal histories, there were 290,178 charges and convictions for an average of four per individual. These included many serious charges or convictions for offenses, such as:
U.S. Bureau of Labor Statistics, Consumer Price Index for All Urban Consumers: All Items in U.S. City Average [CPIAUCSL], retrieved from FRED, Federal Reserve Bank of St. Louis; https://fred.stlouisfed.org/series/CPIAUCSL, March 16, 2024. ↩︎
U.S. Bureau of Labor Statistics, Average Hourly Earnings of All Employees, Total Private [CES0500000003], retrieved from FRED, Federal Reserve Bank of St. Louis; https://fred.stlouisfed.org/series/CES0500000003, March 16, 2024. ↩︎
U.S. Department of the Treasury. Fiscal Service, Federal Debt: Total Public Debt [GFDEBTN], retrieved from FRED, Federal Reserve Bank of St. Louis; https://fred.stlouisfed.org/series/GFDEBTN, March 12, 2024 ↩︎
Board of Governors of the Federal Reserve System (US), Consumer Loans: Credit Cards and Other Revolving Plans, All Commercial Banks [CCLACBW027SBOG], retrieved from FRED, Federal Reserve Bank of St. Louis; https://fred.stlouisfed.org/series/CCLACBW027SBOG, March 15, 2024. ↩︎
The primary source for this article is Fiscal Year 2023 U.S. Immigration and Customs Enforcement, ICE Annual Report, dated December 29, 2023 [URL]. Unless otherwise noted data and quoted material is from this source.
Biden Policies
Enforcement and Removal Operations (ERO) Mission
“ERO’s mission is to protect the homeland through the arrest, detention, and removal of noncitizens1 who undermine the safety of U.S. communities and the integrity of the U.S. immigration system. Its primary areas of focus are interior enforcement operations, management of the agency’s detained and non-detained populations, and removal efforts. In addition to its core interior enforcement activities, over the last several years, ERO has deployed resources to assist the broader DHS enterprise with efforts to manage irregular migration at the Southwest Border, providing both personnel and innovative technical solutions to help ICE, CBP, U.S. Citizenship and Immigration Services (USCIS), and the Department of Justice’s (DOJ) Executive Office for Immigration Review (EOIR) solve cross-agency processing challenges.”
DHS Enforcement Priorities
“Because ERO’s mission is complex and its resources are finite, the agency must balance and prioritize key activities, including interior enforcement efforts. As law enforcement personnel, ERO’s deportation officers are trained to make enforcement decisions on a case-by-case basis, considering the totality of circumstances for each noncitizen and focusing their resources on those noncitizens who represent the greatest threats to public safety or national security. This discretion may be complemented by additional guidance issued by DHS, ICE, and ERO, which ensures enforcement actions align with current policy and mission objectives.
On September 30, 2021, DHS Secretary Alejandro N. Mayorkas issued a memorandum, Guidelines for the Enforcement of Civil Immigration Law, which instructed DHS immigration officials to prioritize the apprehension and removal of noncitizens considered to be threats to national security, public safety, and border security. The memorandum also provided a nonexhaustive list of aggravating and mitigating factors that officers should consider in each case to ensure fair and effective enforcement. At the time the priorities went into effect, ICE trained its law enforcement personnel on how to implement them in a consistent and lawful manner.
However, on June 10, 2022, in Texas v. United States, the U.S. District Court for the Southern District of Texas vacated2 the September 2021 memorandum, and ICE personnel ceased the implementation of the guidelines and returned to the baseline exercise of prosecutorial discretion.
Subsequently, on June 23, 2023, in United States v. Texas3, the U.S. Supreme Court reversed the District Court’s decision in Texas v. United States. The Supreme Court’s decision went into effect on July 25, 2023. On July 28, 2023, ICE reinstituted the application of the September 2021 memorandum, providing implementation training to its personnel to ensure that the aggravating and mitigating factors contained in the memorandum are fully considered and assessed in each case4.
Public Safety and National Security Operations
“ERO officers rely on a range of law enforcement and intelligence techniques to identify noncitizens who are present in the United States without authorization or are otherwise removable; who may represent threats to national security, public safety, and border security; or otherwise undermine the integrity of U.S. immigration laws. Two main programs guide the directorate’s enforcement efforts:
ERO Fugitive Operations conducts targeted enforcement actions through its 129 Fugitive Operations Teams (FOTs) and 10 Mobile Criminal Apprehension Teams (MCATs) to identify, locate, arrest, and remove at-large removable noncitizens.
The Criminal Apprehension Program (CAP) identifies and arrests noncitizens in prisons and jails nationwide who were arrested by other5 law enforcement agencies for criminal activity.
Administrative Arrest
Enforcement and Removal Operations (ERO) conducts administrative arrests of noncitizens [illegal aliens] for civil violations of U.S. immigration law via two primary mechanisms:
At-large arrests occur when ERO conducts enforcement actions within the community (i.e., outside prisons and jails). In addition, ERO conducts administrative arrests that fall into the “at-large” category in several other circumstances, such as when noncitizens [illegal aliens who were encountered by CBP at the Southwest Border and paroled without charging documents subsequently check in to an ERO field office in the interior for further processing and issuance of charging documents, when a public safety redetermination occurs, or when noncitizens are taken into custody for removal purposes.
Custodial arrests occur when Criminal Apprehension Program (CAP) agents work with prisons and jails to identify noncitizens who are potentially amenable to removal and have already been arrested by state and local authorities for criminal activity.
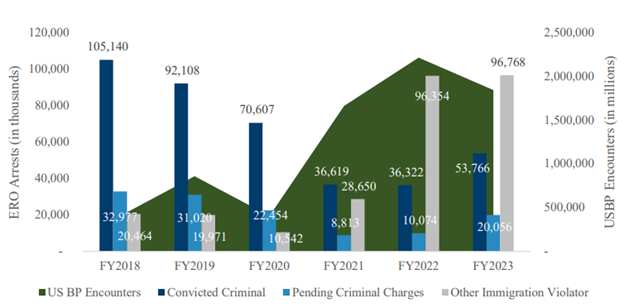
Figure 1. FY 2018 – FY 2023 ERO Administrative Arrests by Criminality with USBP Encounters [FY23 = Oct 1, 2022 – Sep 31, 2023]
ERO arrest activity increased in FY 2023 compared to FY 2022. In FY 2023, ERO conducted 170,590 administrative arrests, representing a 19.5% increase in overall arrests from FY 2022. Of the total arrests conducted by ICE in FY 2023, 43.3% of those arrested had criminal convictions or pending criminal charges, up from 32.5% in FY 2022.
In the FY 2023 group of 73,822 individuals with criminal histories, there were 290,178 charges and convictions for an average of four per individual. These included many serious charges or convictions for offenses, such as:
1,713 charges or convictions for homicide,
1,655 for kidnapping;
4,390 sexual assaults;
33,209 assaults;
3,097 robberies;
6,964 burglaries; and
7,520 weapons offenses.
Moreover, ERO’s at-large arrests in FY 2023 increased by 7.2% compared to FY 2022. In FY 2023, ERO conducted 91,497 at-large arrests, compared to 85,343 at-large arrests in FY 2022.
It appears that “Convicted Criminals” and “Pending Criminal Charges” would be Criminal Apprehension Program (CAP) arrests and “Other Immigration Violations” would likely be dominated by “when noncitizens [illegal aliens] who were encountered by CBP at the Southwest Border and paroled without charging documents subsequently check in to an ERO field office in the interior for further processing and issuance of charging documents, when a public safety redetermination occurs, or when noncitizens are taken into custody for removal purposes.”
The decrease in “Convicted Criminals” and “Pending Criminal Charges” is the result of Joe’s “Executive Order 13768 of January 25, 2017 (Enhancing Public Safety in the Interior of the United States)”, is hereby revoked.
The sharp increase in “Other Immigration Violations” would be the Biden Parole policy,
Since President Biden took office in 2021, his administration has used immigration parole at a historic scale, invoking the decades-old law to welcome hundreds of thousands of foreigners fleeing armed conflicts in Afghanistan and Ukraine, or political and economic crises in countries like Haiti and Venezuela.
Since 1952, parole has empowered federal officials to welcome migrants who don’t have the visas that are typically required to enter the U.S. The law allows these entries if they further a humanitarian cause or public benefit, but it does not give beneficiaries permanent legal status. Instead, migrants paroled into the country are permitted to live and work in the U.S. for a period of time, typically one or two years.
The Biden administration has argued its use of parole has allowed it to respond to emergency situations, such as the Taliban’s reconquest of Afghanistan and the Russian invasion of Ukraine, and to reduce illegal crossings at the southern border by offering would-be migrants legal channels to come to the U.S. Cite: Biden administration has admitted more than 1 million migrants into U.S. under parole policy Congress is considering restricting, CBS, First published on January 22, 2024 / 10:27 AM EST
Comparison – By The Numbers
Figure 2, FY 2018 – FY 2023 ICE Initial Book-Ins by Month and Arresting Agency
Because the data is by fiscal year vice calendar year the number do not align with Presidential Terms, but they are indictive.
Figure 4, Enforcement & Removal Operations by “Presidential Terms”
First the most important number, the Biden Total USBP Encounters vs Trump USBP encounters. Biden had almost 4 times (3.99) the encounters as Trump. Figure 2 shows that Trump benefited from the Covid drop in encounters, but the pre-covid trend was to significantly lower encounters vice the post-covid step function increase in the early days of Biden’s term.
The 4.35 (435.04%) increase in “Other Immigration Violations” most likely due to Biden’s parole policy. Parolees had to check in with ERO within 1 – 3 years after parole. I would speculate that this number may be low, I have found no data on percent of parolees checking-in on or ahead of schedule. It also doesn’t account for the decrease of Interior arrest due to Biden’s cancellation of Trump enhanced interior enforcement6.
Figure 2 show that Biden’s ICE, interior enforcement, was below the Covid rate for the majority of his term, and never reached Trump’s rate.
Finally, Biden’s arrest were 95% of Trump’s on 4 times as many encounters. Leading me to conclude that the Biden borders are neither closed nor secure. I refer back to the breakdown of the FY-23 arrest – “In the FY 2023 group of 73,822 individuals with criminal histories, there were 290,178 charges and convictions for an average of four per individual.”
House Committee on Homeland Security issues a statement after the release of a third selection of transcribed interviews conducted with U.S. Border Patrol chief patrol agents responsible for the sectors along the Southwest border.
Startling Stats on Secretary Mayorkas’ Failure to Deter Mass Illegal Immigration:
Since February 2021, CBP’s Office of Field Operations (OFO) has recorded more than 540,000 NTAs, though CBP has not been transparent about the number of those who were subsequently released into the interior.
Since Jan. 20, 2021, the Biden administration has recorded more than 1.6 million paroles.
Despite Secretary Mayorkas’ repeated promises to make greater use of CBP’s expedited removal authority following the end of the Title 42 public health order, the vast majority of illegal aliens apprehended by the Border Patrol since June have been processed via other means. The percentage of illegal aliens processed under expedited removal has never exceeded 20 percent of all apprehensions since Title 42’s expiration. For example, in October 2023, the Border Patrol issued 120,175 NTAs, but only processed 28,334 aliens via expedited removal.
In response to a subpoena threat, the Committee recently obtained documents from DHS regarding the expanded use of the CBP One app, which showed 95.8 percent of all inadmissible aliens who scheduled appointments through the app between Jan. 12-Sept. 30, 2023, were ultimately issued an NTA and released into the United States on parole.
Since the program began, 269,744 Cubans, Haitians, Nicaraguans, and Venezuelans have been granted mass parole under the administration’s CHNV parole process at ports of entry nationwide. The Committee has threatened to compel DHS to provide information and documents pertaining to this program, as well.
While these individuals are being released into the interior, very few inadmissible aliens are being removed under Secretary Mayorkas’ policies. As detailed in the Committee’s ongoing investigation into Secretary Mayorkas, ICE’s Non-Detained Docket has grown by nearly two million just since FY20, and CBP has recorded 1.7 million known gotaways since Biden took office.
In FY22, ICE conducted a mere 72,177 removals. In FY21, the number was 59,011. By comparison, in FY20, in the midst of the COVID-19 pandemic, ICE removed 185,884 illegal aliens, while in FY19, removals exceeded 267,000.
Meanwhile, as ICE’s FY22 annual report documents, the number of individuals on the Non-Detained Docket with no final order of removal increased by more than one million from FY21 to FY22, while those with a final order of removal only increased approximately 27,000.
Removals of criminal aliens have also declined, with only 38,447 removals of convicted criminal aliens in FY22, compared to around 173,000 total removals of criminal illegal aliens in FY19 (around 77,000 of 85,000 interior removals).
Further Reading
How Long Does Biden’s DHS Wait to Put Paroled Border Migrants into Removal Proceedings?, Center for Immigration Studies, By Andrew R. Arthur on February 11, 2023. URL
SOUTHWEST BORDER, Challenges and Efforts Implementing New Processes [Notice to Report & Parole plus Alternative to Detention] for Noncitizen Families, GAO-22-105456, September 2022.
Biden’s euphemism for illegal aliens, which he previously referred to a migrants, and most recently referred to as “newcomers” in a Whitehouse Fact Sheet. ↩︎
Texas v. United States, 606 F. Supp. 3d 437 (S.D. Tex. 2022). ↩︎
Since the memorandum was not in effect for the first 10 months of FY 2023, this year’s report does not contain associated metrics. However, ICE is assessing reporting over the long term to ensure DHS leadership and external stakeholders receive accurate and transparent information on enforcement actions. ↩︎
Other meaning non-sanctuary cities, counties, and state law enforcement agencies. ↩︎
Due to limited resources, DHS cannot respond to all immigration violations or remove all persons unlawfully in the United States. Rather, DHS must implement civil immigration enforcement based on sensible priorities and changing circumstances. DHS’s civil immigration enforcement priorities are protecting national security, border security, and public safety. DHS Memo “Due to limited resources, DHS cannot respond to all immigration violations or remove all persons unlawfully in the United States. Rather, DHS must implement civil immigration enforcement based on sensible priorities and changing circumstances. DHS’s civil immigration enforcement priorities are protecting national security, border security, and public safety.” ↩︎
Debunking Kamala’s claim: “We have created more than 14 and a half million new jobs, increased wages for tens of millions of Americans. Today, consumer confidence is up and consumer spending is an all-time high.”
Kamala Job Creation Claim
New jobs is a metric that Biden and Harris have heralded as resulting from Bidenomic, i.e.:
We have created more than 14 and a half million new jobs, increased wages for tens of millions of Americans. Today, consumer confidence is up and consumer spending is an all-time high.
Remarks by Vice President Harris at a Campaign Event, South Carolina State University, Orangeburg, South Carolina; February 2, 2024.
Kamala, according to the Bureau of Labor Statistics, Employment Situation Summaries (Job’s Reports) the jobs created, as of the January Jobs Report is 13,425,000 vice 14,500,000.
The Jobs Reports
The Employment Situation Summary, commonly referred to as Jobs Report is issued monthly on the first Friday, for the previous month data, e.g. January 2024 jobs report was released on the first Friday on February. This paper focuses on Establishment Survey Data – Total, monthly change in nonfarm payroll employment. An example, THE EMPLOYMENT SITUATION — JANUARY 2024:
Establishment Survey Data
Total nonfarm payroll employment rose by 353,000 in January, similar to the gain of 333,000 in December. Payroll employment increased by an average of 255,000 per month in 2023. In January, job gains occurred in professional and business services, health care, retail trade, and social assistance. Employment declined in the mining, quarrying, and oil and gas extraction industry. (See table B-1. See the note at the end of this news release and table A for more information about the annual benchmark process.)
Figure 1 is the summation of the monthly data from the January 2017 jobs report to the January 2024 jobs report.
Trump Era
The summary statistics for Trump’s term in office were:
Average -58,120 jobs per month,
Std Dev 3088019 jobs per month,
Median 210,000 jobs per month,
Minimum -20,700,000 jobs per month,
Maximum 4,800,000 jobs per month.
The data is dominate by the recession induced by the coronavirus disease 2019 (COVID-19) pandemic resulted in steep job losses due to the lock down1.
Pre-pandemic, Jan 2017 – February 2020, Donald had an average job creation of 183,135 jobs per month. March and April 2020 saw and average 11,050,00 pandemic related monthly job loss.
The post pandemic rebound, May – July 2020 had a 3,100,000 jobs created per month.
Donald had and average 299,500 jobs created per month for the remainder of his term.
Biden Era
The summary statistics for Joe’s term in office were:
Average 371,556 jobs per month,
Standard Deviation 201,141 jobs per month,
Median 324,000 jobs per month,
Minimum 150,000 jobs per month,
Maximum 943,000 jobs per month.
Joe has had an average 371,556 jobs created per month for his term in office, 24% better than Donald’s post pandemic rebound average.
Seven thousand jobs per month was the average increase in the Federal workforce over Joe’s term.
Wages
Figure 2, the Median usual weekly real earnings2: Wage and salary of workers: 16 years and over, show that median real wages have decrease 2.68% rather than increased. You may be correct if you cherry-pick “tens of millions” vice the workforce.
Consumer Confidence
Regarding Consumer Confidence, Figure 3 shows the Organization for Economic Co-operation and Development3, Consumer Opinion Surveys, which has Confidence down 2.1% since you and Joe took office.
Consumer Spending
With 17.6% inflation since you and Joe took office it would be amazing if consumer spending wasn’t at an “all time high”. In my opinion the metric should be disposable income. Figure 4 show both Disposable Income4 and Real Disposable Income for Joe’s term in office. The graph is indexed to 100 for January 1, 2021. Except for volatility in Real Disposable income in March of 2021 both metrics were underwater until 1st Quarter 2023, when Disposable Income was back up to 101.5 and Real Disposable Income was still underwater at 91.7. Real Disposable Income remained underwater and was 93.6 in December of 2023.
In response to the COVID-19 pandemic in the US, a series of lockdowns mitigating the spread of the pandemic were introduced beginning in March and maintained into July of 2020 when the first wave of the pandemic was largely believed to have passed. U.S. BUREAU OF LABOR STATISTICS ↩︎
U.S. Bureau of Labor Statistics, Employed full time: Median usual weekly real earnings: Wage and salary workers: 16 years and over: Men [LES1252881900Q], retrieved from FRED, Federal Reserve Bank of St. Louis; https://fred.stlouisfed.org/series/LES1252881900Q, February 4, 2024. ↩︎
Organization for Economic Co-operation and Development, Consumer Opinion Surveys: Confidence Indicators: Composite Indicators: OECD Indicator for United States [CSCICP03USM665S], retrieved from FRED, Federal Reserve Bank of St. Louis; https://fred.stlouisfed.org/series/CSCICP03USM665S, February 4, 2024. ↩︎
U.S. Bureau of Economic Analysis, Disposable Personal Income [DPI], retrieved from FRED, Federal Reserve Bank of St. Louis; https://fred.stlouisfed.org/series/DPI, February 5, 2024. ↩︎
The article, refutes the claims of Director of the National Economic Council, Lael Brainard and provides a thorough analysis comparing the economic performance of the Obama, Trump, and Biden administrations, using various metrics such as real wages, employment levels, and real wealth. It debunks Ms. Brainard’s claim of Biden’s “great results. The visuals supplement the analysis effectively.
Statement By Director Of The National Economic Council – Ms. Lael Brainard
When asked; “Then why do you think the phrasing “Bidenomics” has not caught on?” She answered with some cherry picked metrics.
So, I think, again, the President’s economic policies are showing great results in terms of real wage gains, real employment gains, real wealth gains, but we still have work to do on lowering costs.
[added later]
If you look at overall purchasing power, people can buy as much as they could pre-pandemic, and they’ve got $1,700 extra to spend.
So, in fact, the wage gains have outpaced inflation since pre-pandemic, and, of course, employment gains are also, meaning more Americans are getting those paychecks, which is allowing them to continue spending and fueling the really good growth that we’ve seen.
JANUARY 11, 2024, 1:30 P.M. EST; Press Briefing by Press Secretary Karine Jean-Pierre, NSC Coordinator For Strategic Communications John Kirby, and National Economic Council Director Lael Brainard, James S. Brady Press Briefing Room [URL]
The Long View of Bidenomics
My long view of Bidenomics is to compare and contrast Biden’s term with Trump’s term and Obama’s term.
Real [Inflation Adjusted] Wages
My metric is: U.S. Bureau of Labor Statistics, Employed full time: Median usual weekly real earnings: Wage and salary workers: 16 years and over [LES1252881600Q], retrieved from FRED, Federal Reserve Bank of St. Louis; https://fred.stlouisfed.org/series/LES1252881600Q, January 11, 2024. I have normalized the data to 100 on January 1, 2009, Obama took office on January 20, 2009. Thus the magnitude of the change over time is the percent change. A change from 100 to 150 is a 50% increase, while a change from 100 to 90 is a 10% decrease.
Real Wages
Obama
Obama was underwater from 3rd quarter 2009 until 4th quarter 2015, with a low point, down 4.3% to 95.7 in 2nd quarter 2014. From the 4th quarter 2014 there was a near linear increase, dotted green line, in real wages until the end of his term where Real Wages were up 2% to 102.0.
Trump
Trump started his term up 2% at 102.0 and basically followed the linear trend line established by Obama, with a little more volatility, until the 1st quarter of 2020 where real wages were up 4.6% to 106.4. A sharp spike occurred, peaking at the beginning of the 2nd quarter, up 7.5% to 113.9. I would speculate that this sharp rise in real wages was due to loss of low wage hourly workers in the beginning of Covid the Covid shutdown. By the end of Trump’s term, 1st quarter 2021 real wages were back down 4.8% to 108.1
Biden
The downward trend in real wages continued until the 4th quarter of 2021 where it plateaued down an additional 3.2%, to 104.9 in the 4th quarter o4 2021. Back to 4th quarter 2019 levels where it has followed the Obama-Trump slope rising 0.9% to 105.8 at the beginning of the 3rd quarter of 2023, at 105.8 a 4th quarter 2019 level. Still in post-covid recovery. I would not classify Biden’s real wages performance as a “great results” as Ms. Brainard has.
Employment
My metric is; U.S. Bureau of Labor Statistics, Employment Level [CE16OV], retrieved from FRED, Federal Reserve Bank of St. Louis; https://fred.stlouisfed.org/series/CE16OV, January 11, 2024. I have normalized the data to 100 on January 1, 2009, Obama took office on January 20, 2009. Thus the magnitude of the change over time is the percent change. A change from 100 to 150 is a 50% increase, while a change from 100 to 90 is a 10% decrease.
Employment Levels
Obama
Employment levels under Obama were underwater from inauguration until May of 2012. At that point they started a relatively linear increase until January of 2017 where they had increased 7%, to 107.0.
Trump
The near linear increase continued, in Trump’s term until February 2020, increasing an additional 4.6% to 111.6 at the start of the Covid pandemic. There was a precipitous drop of 17.9%, to 93.7 in April 2020. Employment level increased sharply until October of 2020, up 11.8% to 105.5, a 65% recover to pre-pandemic levels. It plateaued from October 2020, a month ahead of the election until January 2021, the beginning of Biden’s term.
Biden
Biden Employment level increased in a linear fashion to an inflection point in March 0f 2022, at near the pre-pandemic level of 111.6, down only 0.3%. Joe’s December 2023 113.4 is back to a slope (rate of change) similar to the pre-pandemic slope. If Biden’s Employment Level continues to increase at the pre-pandemic rate it will be hard to credit him with any improvement in Employment Level. Only time will tell, but I would not classify Biden’s employment performance as a “great results”.
Real [Inflation Adjusted] Wealth
I couldn’t find a U.S. Bureau of Labor Statistics metric for Real Wealth, but I did find Board of Governors of the Federal Reserve System (US), Household Count in the Bottom 50% (1st to 50th Wealth Percentiles) [WFRBLB50300], retrieved from FRED, Federal Reserve Bank of St. Louis; https://fred.stlouisfed.org/series/WFRBLB50300, January 12, 2024 and the Consumer Price Index (Inflation) is available, U.S. Bureau of Labor Statistics, Consumer Price Index for All Urban Consumers: All Items in U.S. City Average [CPIAUCSL], retrieved from FRED, Federal Reserve Bank of St. Louis; https://fred.stlouisfed.org/series/CPIAUCSL, January 12, 2024. As usual, I have normalized the data to 100 on January 1, 2009, Obama took office on January 20, 2009. Thus the magnitude of the change over time is the percent change. A change from 100 to 150 is a 50% increase, while a change from 100 to 90 is a 10% decrease.
Substitute for Real Wealth, Household Count in the Bottom 50% and CPI.
Obama
Obama term had a near linear growth in Household Count, green dotted line, and CPI, Household Count of house holds in the bottom 50 percent of wealth rose 8.3% to 108.3. While CPI also rose in a near linear fashion 15% to 115.0 on January 1, 2017.
Trump
Trump continued the near linear trend in Household Count, up 15.6% to 123.9 in January of 2021. Pre-pandemic CPI continued a near linear rise of 7.2% to 122.2 in January of 2020. There was a downward inflection point in February 2020 followed by an upward inflection point in May 0f 2020, dropping 1.6% to 120.7. Followed by a rise of 3.2%, to 123.9 on January 1, 2021, red dotted line, which has a steeper slope, higher rate of inflation, than the pre-pandemic rate.
Biden
Joe took office with a CPI of 123.9, up 23.9% from January 1, 2009, after a near linear growth through the pre-pandemic Obama and Trump administrations. Inflation continued at a post pandemic linear rate, red dotted line, until September 2021 where it was up 5.4% to 129.3. This was another inflection point, where the slope, rate of inflation rose again, green dotted line. The new rate continued until June 2022 where it moderated. At this point it was up 18.1% over September 2021 at 137.4. Inflation continued to rise at a near linear rate, yellow dotted line until December 2023, most recent data, up 21.8% since Joe took office. Inflation under Obama and Trump was up 23.9% in 12 years, in just 3 years Joe has managed to garner 21.8% inflation. I would not classify Biden’s Inflation performance as a “great results”.
Biden continued the linear trend in the Household Count in the Bottom 50%, it was up 1.9% from January 2021 to 3rd quarter of 2023, the most recent data. I suspect that Joe’s 21.8% inflation would have a significant deleterious effect on Real Wealth. If I am correct about the inflation’s affect on Real Wealth I would not classify Biden’s Real Wealth performance as a “great results”.
Other Metrics Mentioned By Ms. Brainard
Purchasing Power
“If you look at overall purchasing power, people can buy as much as they could pre-pandemic, and they’ve got $1,700 extra to spend.”
My metric for Purchasing Power is; U.S. Bureau of Labor Statistics, Consumer Price Index for All Urban Consumers: Purchasing Power of the Consumer Dollar in U.S. City Average [CUUR0000SA0R], retrieved from FRED, Federal Reserve Bank of St. Louis; https://fred.stlouisfed.org/series/CUUR0000SA0R, January 12, 2024.
My metric for “extra to spend” is; U.S. Bureau of Economic Analysis, Real Disposable Personal Income [DSPIC96], retrieved from FRED, Federal Reserve Bank of St. Louis; https://fred.stlouisfed.org/series/DSPIC96, January 12, 2024.
Purchasing Power
Both Purchasing Power and Real Disposable Income are near linear functions over the time span, so I am not going to discuss Obama or Trump, but focus on Biden.
There was some positive volatility in Real Disposable Income early in Joes term, but it returned to the linear trend line quickly. Thus I would not not classify Biden’s Real Disposable Income performance as a “great results”.
Biden has been under the trend line for Purchasing Power for his term to date. Therefore I would not not classify Biden’s Purchasing Power performance as a “great results”.
Wage Gains
“So, in fact, the wage gains have outpaced inflation since pre-pandemic, and, of course, employment gains are also, meaning more Americans are getting those paychecks, which is allowing them to continue spending and fueling the really good growth that we’ve seen.”
My metric is; U.S. Bureau of Labor Statistics, Employed full time: Median usual weekly real earnings: Wage and salary workers: 16 years and over [LES1252881600Q], retrieved from FRED, Federal Reserve Bank of St. Louis; https://fred.stlouisfed.org/series/LES1252881600Q, January 12, 2024.
Since Real Wages are inflation adjusted, if inflation matches wage increases it will be a flat line. If inflation exceeds wage increase it will be a decreasing over time line. If wage increases exceed inflation it will rise over time.
Real (Inflation Adjusted) Wages
OBama
From inauguration to 2nd quarter 2014 inflation was greater than wage gains, red dashed line. From 2nd quarter 2014 to the end of his term wage gain exceeded inflation.
Trump
Trump experienced volatility followed by wages outpacing inflation up to the Covid pandemic. I suspect the spike/crash leading to the end of his term was a statistical anomaly due to job loss/recovery by low paid workers affecting the median.
Biden
The early months of Biden’s term saw inflation outpacing wages until 2nd quarter of 2022. From the 2nd quarter of 2022 to the 3rd quarter of 2023, wages were slightly ahead of inflation by 1.9%. Looking at the graph, it is visually apparent that the slope, rate of change, for Joe is less than either Trump or Obama. I would not classify Biden’s Real Wage performance as a “great result.”
The forty-five page Trump indictment, filed 1 August 2023, by 54 year old Special Counsel Jack Luman Smith, charge four counts of criminal activity:
COUNT ONE, (Conspiracy to Defraud the United States—18 U.S.C. § 371) – From on or about November 14, 2020, through on or about January 20, 2021, in the District of Columbia and elsewhere, the Defendant, DONALD J. TRUMP, did knowingly combine, conspire, confederate, and agree with co-conspirators, known and unknown to the Grand Jury, to defraud the United States by using dishonesty, fraud, and deceit to impair, obstruct, and defeat the lawful federal government function by which the results of the presidential election are collected, counted, and certified by the federal government. _______________________________________________ Nota Bene! Donald J. Trump was President during this period, for him to do anything as Candidate Trump from the White House vice his Arlington, Va. campaign headquarters, in the Republican National Committee annex, would be a Hatch Act violation. Jack Smith has not charged a Hatch Act violation. This would seem to acknowledge that he was acting in his Presidential role.
This comment also applies to counts; 2, 3, and 4. _______________________________________________
COUNT TWO, (Conspiracy to Obstruct an Official Proceeding—18 U.S.C. § 1512(k)) – From on or about November 14, 2020, through on or about January 7, 2021, in the District of Columbia and elsewhere, the Defendant, DONALD J. TRUMP, did knowingly combine, conspire, confederate, and agree with co-conspirators, known and unknown to the Grand Jury, to corruptly obstruct and impede an official proceeding, that is, the certification of the electoral vote, in violation of Title 18, United States Code, Section 1512(c)(2). (In violation of Title 18, United States Code, Section 1512(k))
COUNT THREE, (Obstruction of, and Attempt to Obstruct, an Official Proceeding—18 U.S.C. §§ 1512(c)(2), 2) – From on or about November 14, 2020, through on or about January 7, 2021, in the District of Columbia and elsewhere, the Defendant, DONALD J. TRUMP, attempted to, and did, corruptly obstruct and impede an official proceeding, that is, the certification of the electoral vote. (In violation of Title 18, United States Code, Sections 1512(c)(2), 2)
Against Rights—18 U.S.C. § 241) – From on or about November 14, 2020, through on or about January 20, 2021, in the District of Columbia and elsewhere, the Defendant, DONALD J . TRUMP, did knowingly combine, conspire, confederate, and agree with co-conspirators, known and unknown to the Grand Jury, to injure, oppress, threaten, and intimidate one or more persons in the free exercise and enjoyment of a right and privilege secured to them by the Constitution and laws of the United States—that is, the right to vote, and to have one’s vote counted. (In violation of Title 18, United States Code, Section 241)
OLC Memoranda
In 1973, amid the Watergate scandal, the Department of Justice’s Office of Legal Counsel (OLC) issued a memorandum concluding that it is unconstitutional to prosecute a sitting president. Its arguments include that the president “is the symbolic head of the Nation. To wound him by a criminal proceeding is to hamstring the operation of the whole governmental apparatus in both foreign and domestic affairs.” It says that the statute of limitations should not be tolled while the president is in office, but suggests that Congress could extend the statute of limitations specifically for presidents. After the U.S. Supreme Court’s decision in Clinton, the OLC issued a second memorandum in 2000, distinguishing civil and criminal presidential immunity and determining that it was still improper to prosecute a president due to the adverse affect it might have on his ability to govern.
Neither memorandum has force of law, but both are binding within the Department of Justice. Because they were not promulgated with room for public comment, they do not qualify as administrative law either; rather, they are an internal prosecutorial policy. The memoranda are not taken to bar investigating the president or even announcing a determination that the president has broken the law, as Nixon, Clinton, and Donald Trump have all been subject to criminal investigations while in office.
Frank J. sent a private message to AIGS Facebook Page:
Hello! I’m trying to track down where Major Albert Lowry (Lowery) could be buried. Do you know where individuals from Fernandina were buried in the late 19th century? He apparently owned a farm close to Fernandina and Chester and died in 1899 (obituary attached). With the attached Florida Times-Union October 27, 1899 newspaper clipping:
The genealogical research presented here has been done by a non-professional, with 20+ year experience. It is the responsibility of the user to verify the relevance of the data to their specific inquiry.
Jim Miller 2023
Checking AIGS Online Data
The Amelia Island Genealogical Society Website (URL)
Nassau County Cemeteries
The surveys for 69 Nassau Nassau County Florida cemeteries are contained in our database. They are searchable by name and/or cemetery. This compilation of cemetery surveys involved countless hours of volunteer work. Thanks to everyone who has contributed!
The form below allows you to search all of the cemeteries at one time in the event you are not certain where your ancestor was buried in Nassau County, Florida. You can then sort those results by clicking on any of the header columns. If you know the cemetery name in which your ancestor was buried then it may be more prudent to search through only those results. You can do that at the following page: Nassau County Cemeteries
No Matching Results for “Albert Lowery”
No Matching Results for “Albert Lowry”
No Matching Results for “Lowry”
No Matching Results for “Lowery”
1850 Nassau County Census
The 1850 Federal Census for Nassau County, Florida was taken by Charles W. Pelot between October 28th and November 29th, 1850 and reflected the population on June 1, 1850, and includes 1087 individuals in Nassau County Florida. The census pages for Nassau County begins at 341 and go through 367. The Census is searchable by both first and last name, but also typically contains: Age, Sex, Occupation, Birthplace, Birth Year, and Birthplace (generally the state where the individual was born) and a few notes.
No matching records found for Lowery.
No matching records found for Lowry.
1864 Census of Fernandina
In March 1862, a Union fleet of some 26 vessels under the command of Navy Flag Officer Samuel F. DuPont arrived at Fernandina from its base at Port Royal, South Carolina. Confederate troops had been withdrawn in the face of this overwhelming Union force and both Fernandina and nearby Fort Clinch were captured without violence. Most of the community’s residents also fled the island for Confederate held areas in the interior. For the remainder of the war, Fernandina was a center of operations for the Union Navy’s South Atlantic Blockading Squadron, a rest center for Union troops, and a base for Union raiding expeditions into the adjacent areas of Florida and Georgia.
After this occupation, Fernandina became a haven for Unionist refugees and escaped slaves from Florida and Georgia.
On the 8th day of December 1864 Captain John H. Brinker, who was a captain of the 107th Ohio Volunteers, and the Provost Marshall for Fernandina, completed a census of the the civilian population under the protection of the Union Army in Fernandina. This was part of a larger census ordered for the east coast of Florida including Jacksonville, Fernandina and St. Augustine.
During the Civil War, Confederate-owned slaves who sought refuge in Union military camps or who lived in territories that fell under Union control were declared “contraband of war”. This policy was first articulated by General Benjamin F. Butler in 1861, in what came to be known as the “Fort Monroe Doctrine,” established in Hampton, Virginia. By war’s end, the Union had set up 100 contraband camps in the South. Many adult freedmen worked for wages for the Army at such camps, teachers were recruited from the North for their schools by the American Missionary Association, and thousands of freedmen enlisted from such camps in the United States Colored Troops to fight with the Union against the Confederacy. Therefore, it is an important link for blacks who haven’t established their family background.
This is an important document for several reasons; it lists the last place of residence and the date of arrival in the area, as well as the previous owner of the “Contraband” (the term used to describe freed slaves) living in Union controlled areas before the Emancipation Proclamation. This census does not contain many of the names of early residents of Fernandina as most of them left, going to other areas ahead of the arrival of Union Troops. The names used in this census may not be exactly the same as the name used by the family today, so we encourage experimentation with similar sounding names to find the family, or exploration using the pagination. The names of the prior owners listed may be approximations of the real name heard for the first time by a census taker. It is searchable by last name, given name, age, census page number, and census row. It is initially sorted by page and row from lowest to highest, but you can sort by any column.
This document came to us through Edith Mixon of Jacksonville who discovered it in the National Archives. The individual pages were written on both sides and “four folded”, so that creases can be seen in the copies. These data was originally published in the first three volumes of the The Nassau County Genealogist by Jean Mann, who has also copied them into a format that could be used in our online database. It was integrated into our database to make it more available to individuals who might have ancestors who were in Fernandina during this critical period.
No matching records found for Lowery.
No matching records found for Lowry.
1895 Florida State Census for Nassau County Florida
A State Census is an extremely valuable tool for research covering the period between 1880 and 1900, since the Federal Census for 1890 was almost completely destroyed. Florida conducted statewide censuses in both 1885 and 1895, and a transcription of the 1895 Nassau County census data is posted here.
While data from almost all of the Florida counties exist from the 1885 Census, data from Nassau County and three other Florida counties is missing. So, the 1895 census of Nassau County is the only census data available to you for that critical “twenty year” gap in the Federal Census records.
No Matching Result Found for Lowery
No Matching Result Found for Lowry
Civil War Confederate Pension Applications
The first Confederate pensions in Florida were authorized in 1885 and granted to veterans the sum of $5.00 per month. The next three decades saw a new Confederate pension bill introduced at nearly every session of the Legislature. Residency requirements were added and adjusted, militia members and widows were declared eligible, various financial qualifications were added and changed, and the amount and method of distribution were changed many times.
The data you see here are an extract of the files for both individual pensions and widows pensions. The widow’s application is filed with that of her husband. The complete pension record can contain a significant amount of information regarding the individual and the widow if she filed. Our data however is limited to: The case number; first and last name; unit name and number; Widows name; and year filed. Confederate pensions were awarded to residents of Florida regardless of the state in which their service was rendered.
Nassau County Wills Index 1870-1908
The Index of wills for Nassau County Florida from 1870 to 1908 contains 105 Wills which are summarized in this data set. They are also contained in their complete form on Family History Library microfilm, # 954987.
No matching records found for Lowery.
No matching records found for Lowry.
The Nassau County Genealogist
Since 1992 the Amelia Island Genealogical Society members have published a quarterly called The Nassau County Genealogist. A print only publication, indexed in PERSI, The Nassau County Genealogist features stories and history of Nassau County, Florida, and its people. It also provides genealogical records which pertain to Nassau County, Florida. Jean Mann has served as the sole editor since the quarterly was first published.
An Albert Lowery Jr was found in 1930 Federal and 1935 State Census, in Nassau County. But, due to race and DOB it is unlikely he is related to Major Lowery.
Name: Albert Lowery Jr.
Sex: Male
Age: 51
Birth Year (Estimated): 1879
Birthplace: South Carolina
Marital Status: Married
Race: Negro
Relationship to Head of Household: Head
Father’s Birthplace: North Carolina
Mother’s Birthplace: North Carolina
Event Type: Census
Event Date: 1930
Event Place Precinct 11, Nassau, Florida, United States
Event Place (Original) Precinct 11, Nassau, Florida, United States
Line Number: 60
Sheet Letter: B
Sheet Number: 6
Affiliate Publication Number: T626
Affiliate Name: The U.S. National Archives and Records Administration (NARA)
Albert Lowery Jr.’s Spouses and Children
Lilla Lowery, Wife
These were only hits for Albert Lowery in Nassau County. No records were found for Lowry surname.
1850 U.S. Census
No Results Found Albert Lowery in Nassau County, Florida
1860 U.S. Census
No Results Found in Nassau County, Florida
1870 U.S. Census
No Results Found in Nassau County, Florida
1880 U.S. Census
No Results Found in Nassau County, Florida
1900 U.S. Census
No Results Found in Nassau County, Florida
Bureau of Land Management Track Books, 1800 – 1955
No land grant records found for Albert Lowery/Lowry.
Ancestry
U.S., Military and Naval Academies, Cadet Records and Applications, 1800-1908
About U.S., Military and Naval Academies, Cadet Records and Applications, 1800-1908
The U.S. Military Academy, also known as West Point or Army, was founded in 1802 in West Point, New York. The U.S. Naval Academy, also known as Annapolis, was established in 1845 and is located in Annapolis, Maryland. This database contains various records from these two schools.
Military Academy Records: Name index to Military Academy cadet application papers, 1805-1866
This index is arranged alphabetically by the first letter of the applicant’s surname, thereunder by the initial vowel sound of the surname, and thereunder chronologically by application date.
Information listed in the index includes: name of applicant, year of application, state from which candidate applied, and file number of the application papers.
The original index was compiled by the War Department. The National Archives later made a few notes and additions to the index. Entries for which correspondence has been found have been marked with an asterisk (*) by the National Archives. On entries where the file number for the correspondence was omitted, the National Archives added the number to the index in brackets. The National Archives also added supplemental index entries of names that the War Department omitted in their compilation. These entries are filmed in appropriate alpha and chronological order.
Military Academy registers, 1867-1894
These records are arranged chronologically and can list name of applicant, district number, office number, file number, event year, and general remarks.
Register of cadet applications, 1819-1867
These registers are arranged chronologically into year ranges and thereunder by state. The registers may list name of applicant, section of the state where from, date of application, age at time of application, by whom recommended, nature of qualification, date of appointment, and general remarks.
The Florida Digital Newspaper Library (FDNL) exists to provide access to the news and history of Florida Newspapers are a state treasure, the historian’s and genealogist’s best friend, and the community’s collective memory. In the world of newspapers, today’s news is already history, from the moment the stories are printed.
The University of Florida hosts FDNL and a majority of newspapers are from the P.K. Yonge Library of Florida History at UF’s George A. Smathers Libraries. Additional collection content has been generously contributed by collaborating libraries, historical societies, and other organizations throughout the State of Florida. UF began a collection and preservation effort in 1944 for acquisition of at least one newspaper from each of Florida’s 67 counties on an ongoing basis. The library began to produce in-house microfilm copies of its Florida newspapers in 1947 and continued through 2005. Microfilming efforts ceased when UF started large scale digitization in 2005, and UF began born-digital ingest in 2008 when digital became the production standard for current publications.
No Nassau County newspaper was found for 1899. One hundred and four newspapers were found for Duval County, it will be left to the inquirer to investigate.
Clarks River
Clarks River/Stream/Creek does not appear in the U.S.G.S. Geographic Name System. The “stream” features in Nassau County.
Stream GNIS Features in Nassau CountyGNIS Feature Names in the vicinity of Chester/Fernandina.
The “obituary” gives us “Major Lowery came here (County Court House, Fernandina) about 20 years ago (circa October 27, 1879) and purchased a small farm on the Clarks river, about three miles from Chester and about six miles from this city (Fernandina).
Plotting the ranges:
Approximate Location of Lowery Farm based on ranges, assuming as the crow flies.
From the White House Brief Room on 13 September 2023, I believe this is likely a press-release by White House staff, rather than a statement by Joe Biden in the Briefing Room.
In it I find nine claims (1 – 9) that I can determine the factual basis and one (10) that is not specific enough to fully address.
**********Reformatted to highlight Joe’s claims********
Today’s report provides more evidence that
[1] core inflation is trending down toward pre-pandemic levels
[2] at a time when employment remains strong.
[3] Unemployment has remained below 4% for 19 months in a row,
[4] the share of working age Americans with a job is the highest in 20 years,
[5] and real wages are higher now than they were before the pandemic.
[6] Overall inflation has also fallen substantially over the last year,
[7] but I know last month’s increase in gas prices put a strain on family budgets.
[8] That’s why I remain laser-focused on cutting energy costs, including by investing in clean energy to bolster our energy security.
[9] We’re continuing to build an economy from the middle out and bottom up, with better jobs and lower costs —
[10] even as Republicans in Congress push for tax cuts for the wealthy and large corporations and devastating cuts to programs hard-working Americans count on.
“core inflation is trending down toward pre-pandemic levels”
Let me start with Joe’s selection of a metric. The CPI is issued monthly. The August CPI was published on September, 13, 2023 by the Department of Labor’s Bureau of Labor Statistics. In my analysis I will use the metric change over Joe’s term versus monthly change. There are seven variations of the CPI:
Consumer Price Index for All Urban Consumers (CPI-U): U. S. city average, by expenditure category
Consumer Price Index for All Urban Consumers (CPI-U): U. S. city average, by detailed expenditure category
Consumer Price Index for All Urban Consumers (CPI-U): U. S. city average, special aggregate indexes
Consumer Price Index for All Urban Consumers (CPI-U): Selected areas, all items index
Chained Consumer Price Index for All Urban Consumers (C-CPI-U) and the Consumer Price Index for All Urban Consumers (CPI-U): U.S. city average, all items index
Consumer Price Index for All Urban Consumers (CPI-U): U.S. city average, by expenditure category, 1-month analysis table
Consumer Price Index for All Urban Consumers (CPI-U): U.S. city average, by expenditure category, 12-month analysis table
There is no Core CPI in the list.
A big issue is the difference between CPI and Core CPI.
CPI is the consumer price index. A measure of the cost of living for the typical person.
Core CPI is the CPI minus energy and food prices.
Energy and food prices are removed because they have tendency to be highly volatile.
So, Joe has chosen to disregard energy and food inflation, e.g. he is cherry-picking the metric to make himself look good.
Data
My go-to source for economic data is the St. Louis Federal Reserve (FRED), they let the user tailor the data to their needs. In this case I am presenting, Figure 1 upper, the CPI over Joe’s term in office (1 Feb 2021 – 1 Aug 2023. And the same data, Figure 1 lower, indexed to 1 Feb 2021, which give me the percent change if I subtract 100 from the indexed value.
Figure 1, CPI and Core CPI
The BLS news release provides:
The Consumer Price Index for All Urban Consumers (CPI-U) rose 0.6 percent in August on a seasonally adjusted basis, after increasing 0.2 percent in July, the U.S. Bureau of Labor Statistics reported today. Over the last 12 months, the all items index increased 3.7 percent before seasonal adjustment.
The index for gasoline was the largest contributor to the monthly all items increase, accounting for over half of the increase. Also contributing to the August monthly increase was continued advancement in the shelter index, which rose for the 40th consecutive month. The energy index rose 5.6 percent in August as all the major energy component indexes increased. The food index increased 0.2 percent in August, as it did in July. The index for food at home increased 0.2 percent over the month while the index for food away from home rose 0.3 percent in August.
The index for all items less food and energy rose 0.3 percent in August, following a 0.2-percent increase in July. Indexes which increased in August include rent, owners’ equivalent rent, motor vehicle insurance, medical care, and personal care. The indexes for lodging away from home, used cars and trucks, and recreation were among those that decreased over the month
It’s quite obvious why Joe chose Core CPI over CPI, the CPI was three times larger.
The metric that should be reported is CPI change over Joe’s term in office, up 16.2%. If Joe had reported Core CPI over his term in office, it was 14.4%.
Unless you don’t drive or have followed Joe’s advice and drive an EV, and you don’t eat, the CPI is more relevant to your life.
Claim No. 2
“at a time when employment remains strong.”
I will choose the “Employment Level” from the Current Population Survey as my metric. Figure 2 is the St. Louis Federal Reserve’s plot of “Employment Level” over Joe’s term in office, index to 2 Feb 2021.
Figure 2, Employment
I wouldn’t call a month over month (Aug/Jul) increase of 0.1% strong. Strong would be the 5.4% from 1 Feb 2021 to 1 Mar 2022. The April 2022 to date would be weak in my opinion.
Claim No. 3
“Unemployment has remained below 4% for 19 months in a row”.
The statement is true, but disregard’s the fact that August month over month rise is 7.3% of the indexed employment. This could be the beginning of an upward trend.
Figure 3, Indexed Employment and Unemployment.
Claim No. 4
“The share of working age Americans with a job is the highest in 20 years.”
Figure 4, Indexed Employment Rate going back twenty years
The current rate is 1.5% above the rate 20 years ago. The current rate is 3.9% above the pre-pandemic rate and 0.4 percent below the December 2006 apex of the graph, the 20 year point is 1.9% below the apex. The post recession, gray area, trend would have produced a number significantly higher than 1.5%, had it not been for the pandemic.
Claim No. 5
“and real wages are higher now than they were before the pandemic.”
My metric is indexed Employed full time: Median usual weekly real earnings: Wage and salary workers: 16 years and over, reported quarterly.
Figure 5, Employed full time: Median usual weekly real earnings: Wage and salary workers: 16 years and over.
Q-2, 2023 is 99.5% of Q-1, 2020. It is also 2.1% below when Joe took office. Joe may have more granular data. The trend will have Q-3 data above the index value, the trend is going that way since Q-2022. This is not a performance I would brag about.
Claim No. 6
“”Overall inflation has also fallen substantially over the last year.”
Figure 6, Indexed Consumer Price Index for All Urban Consumers: All Items in U.S. City Average, monthly.
The Aug 23 CPI is 3.7% above the Aug 22 CPI and it increased every month. Either Joe was using some other metric or (left to the reader to determine).
Claim No. 7
“but I know last month’s increase in gas prices put a strain on family budgets.”
My metric for the is U. S. Energy Information Administration’s Gasoline – All Grades.
Figure 7, EIA monthly Gasoline – All Grades Price
Yes, you have found something that we can agree on, $0.24/gal. will put a strain on lower income family budgets. A family with both working, and driving to work separately will see an increase proportional to the miles they drive.
Claim No. 8
“That’s why I remain laser-focused on cutting energy costs, including by investing in clean energy to bolster our energy security.”
There is no metric that I am aware of for “energy security”, but one element of “energy security” is the Strategic Petroleum Reserve which you continue to deplete. After a short hiatus, you have resumed the drawn since March 23.
Claim No. 9
“We’re continuing to build an economy from the middle out and bottom up, with better jobs and lower costs —”
Every since you put forward this goal, I have wondered what metric you are using. I have yet to see any data that would lead me to believe that you are making progress.
Claim No. 10
“even as Republicans in Congress push for tax cuts for the wealthy and large corporations and devastating cuts to programs hard-working Americans count on”
There is insufficient data for me to comment, you would need to cite bills that have passed either the Senate or the House.